The question
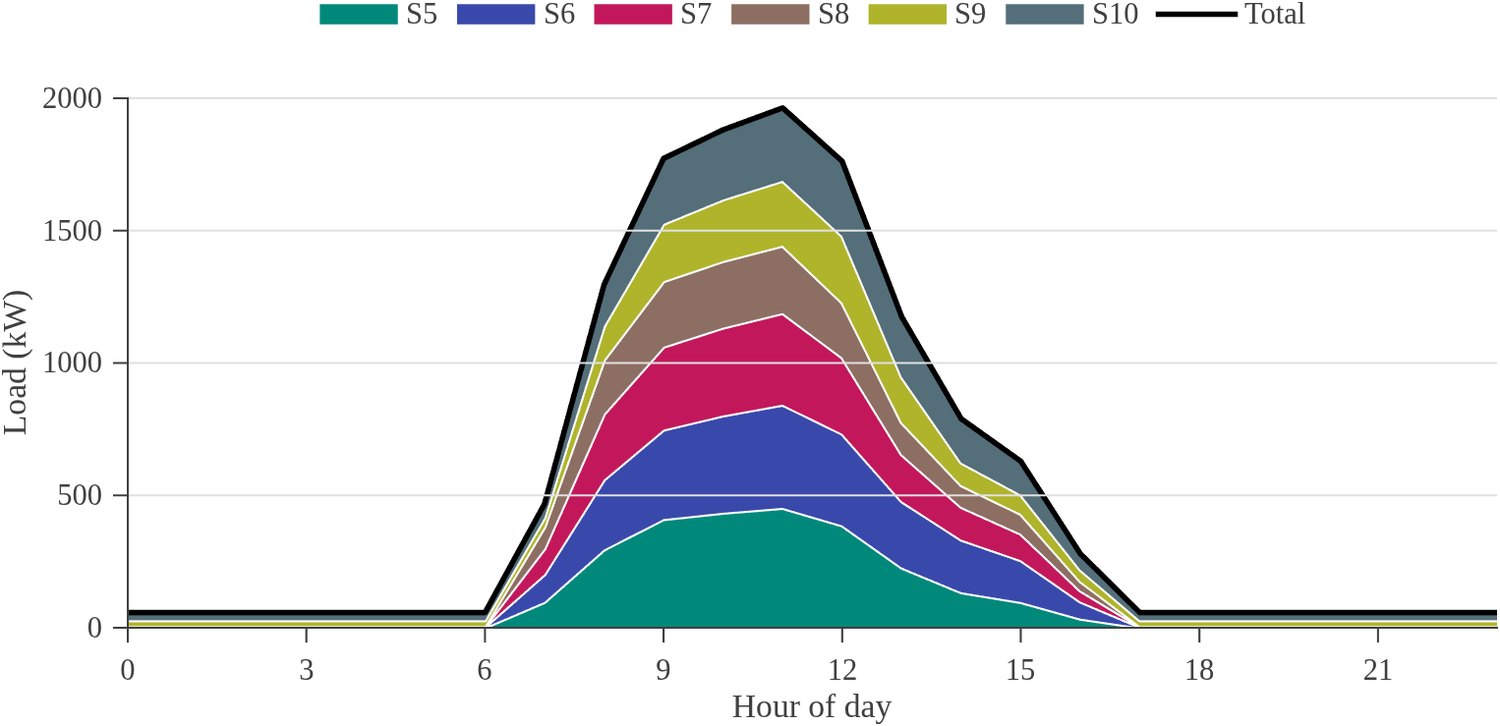
The S-Block complex (blocks S5 to S10) is a daytime-peaked campus load: 381 audited appliance records, 2,618.3 kW connected, and 3.78 GWh of demand a year with a weekday peak of 1,963.6 kW. The study asked what hybrid renewable system could serve that load, how much of it could come from site generation, and whether the investment made sense over 25 years.
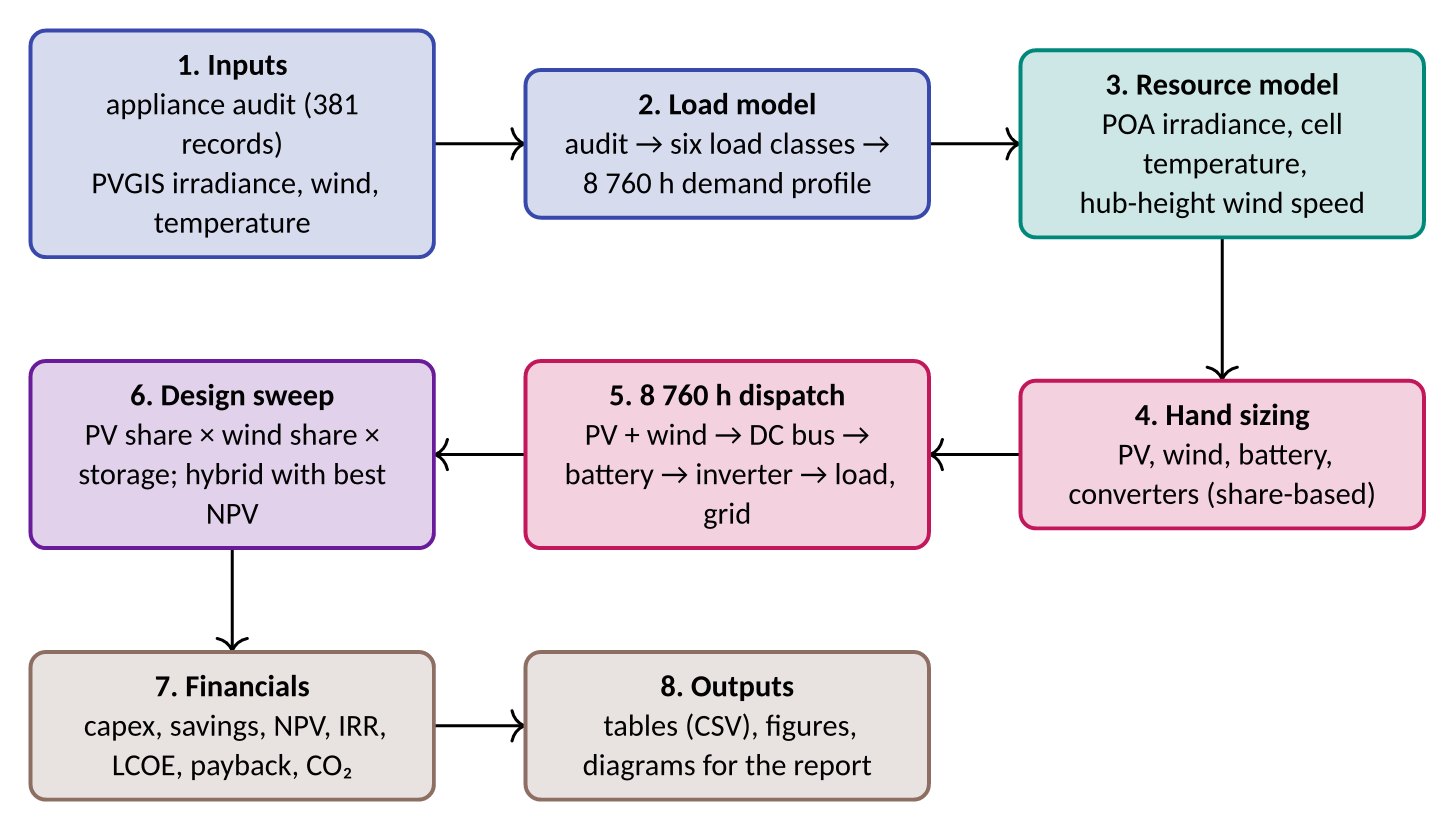
It was not a paper exercise in sizing. The brief required a defensible load model, a real resource assessment for Durban, an hourly dispatch simulation, and an economic case with the assumptions exposed.
Load audit and profile
Every appliance record was grouped by building and by use: air-conditioning, lighting, plug loads, laboratory equipment and the overnight base load. Utilisation factors and the academic calendar were applied to turn connected power into an hourly demand profile rather than a flat annual figure.
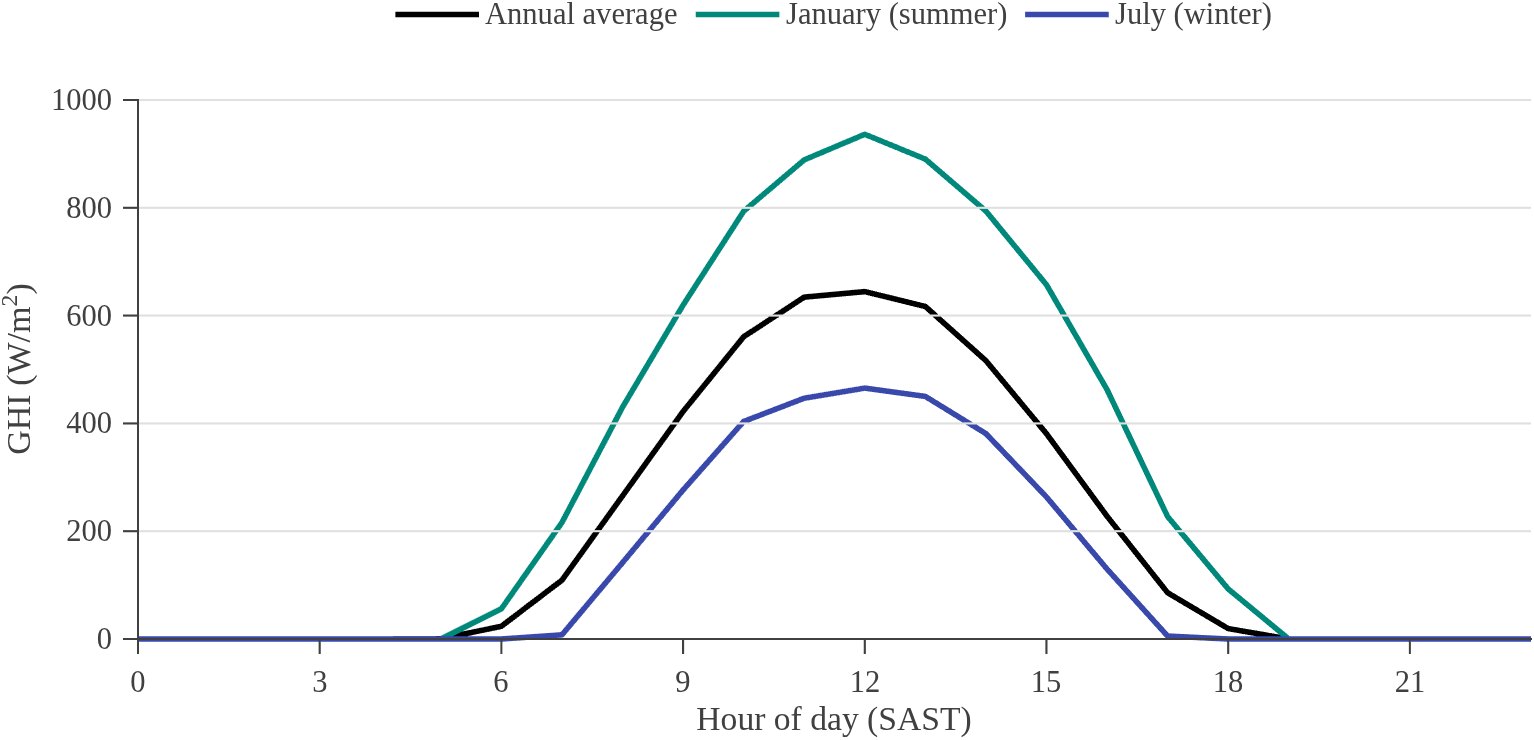
The audit gives 15,230.8 kWh/day of raw appliance energy and 10,359 kWh/day after diversity and scheduling. The resulting profile peaks in the middle of the teaching day, which matters: it lines up reasonably well with solar, but the evening base load and winter mornings still need storage or the grid.
Resource and sizing
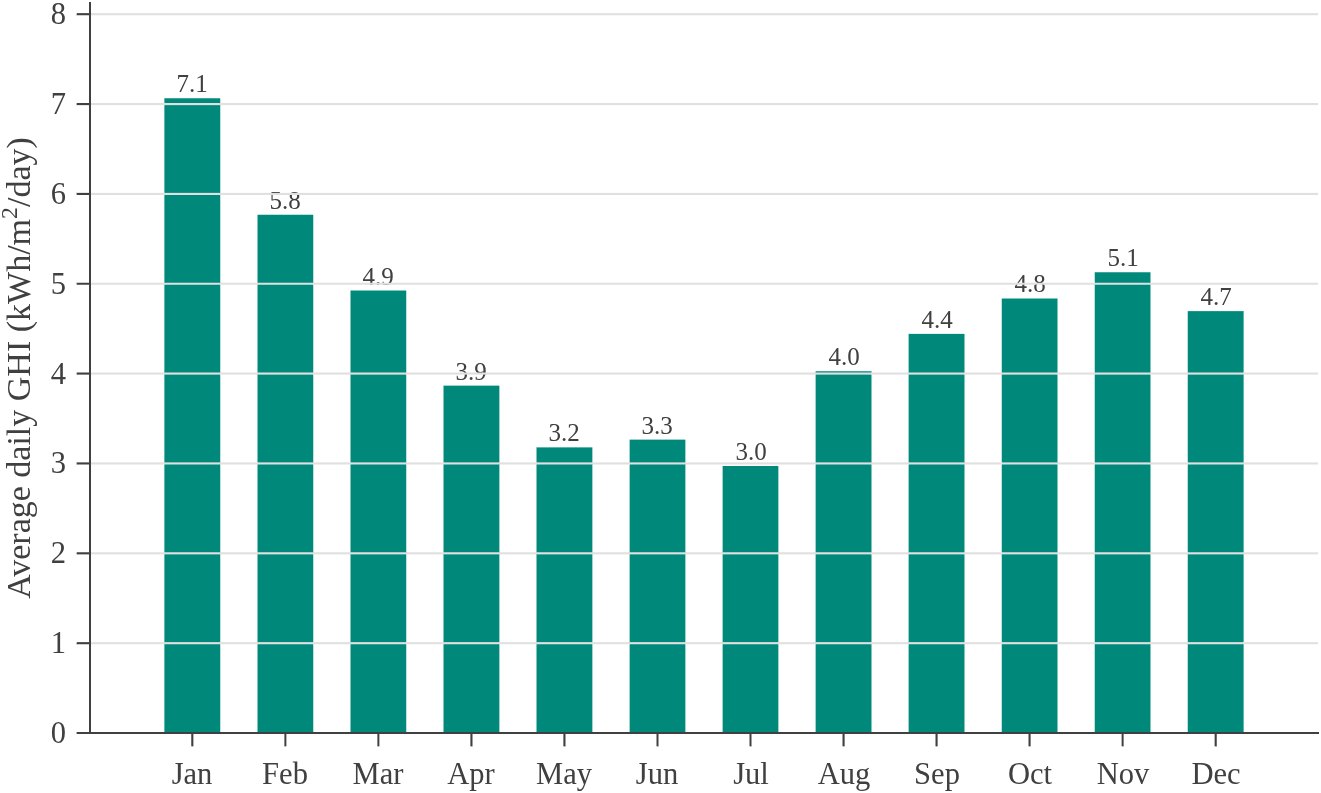
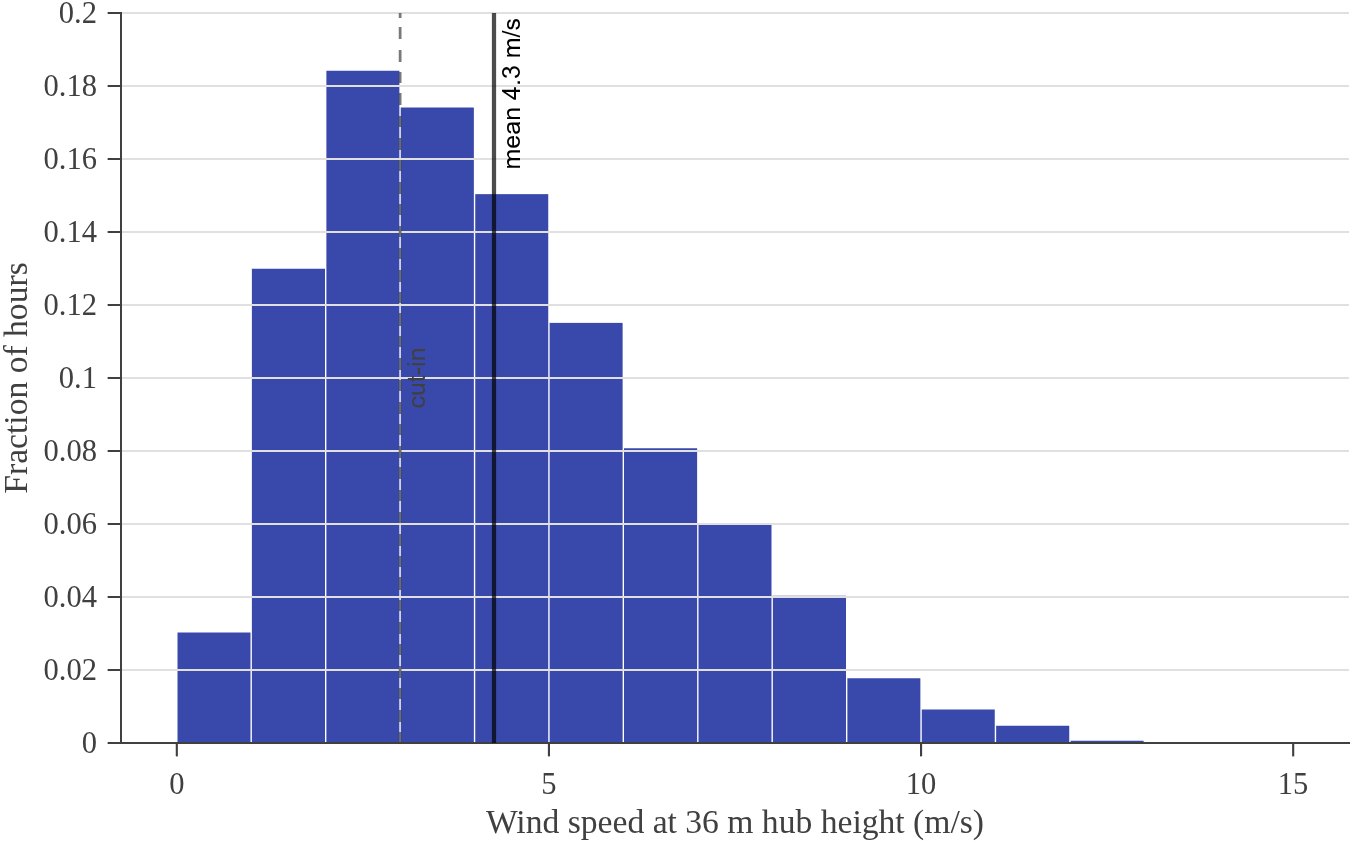
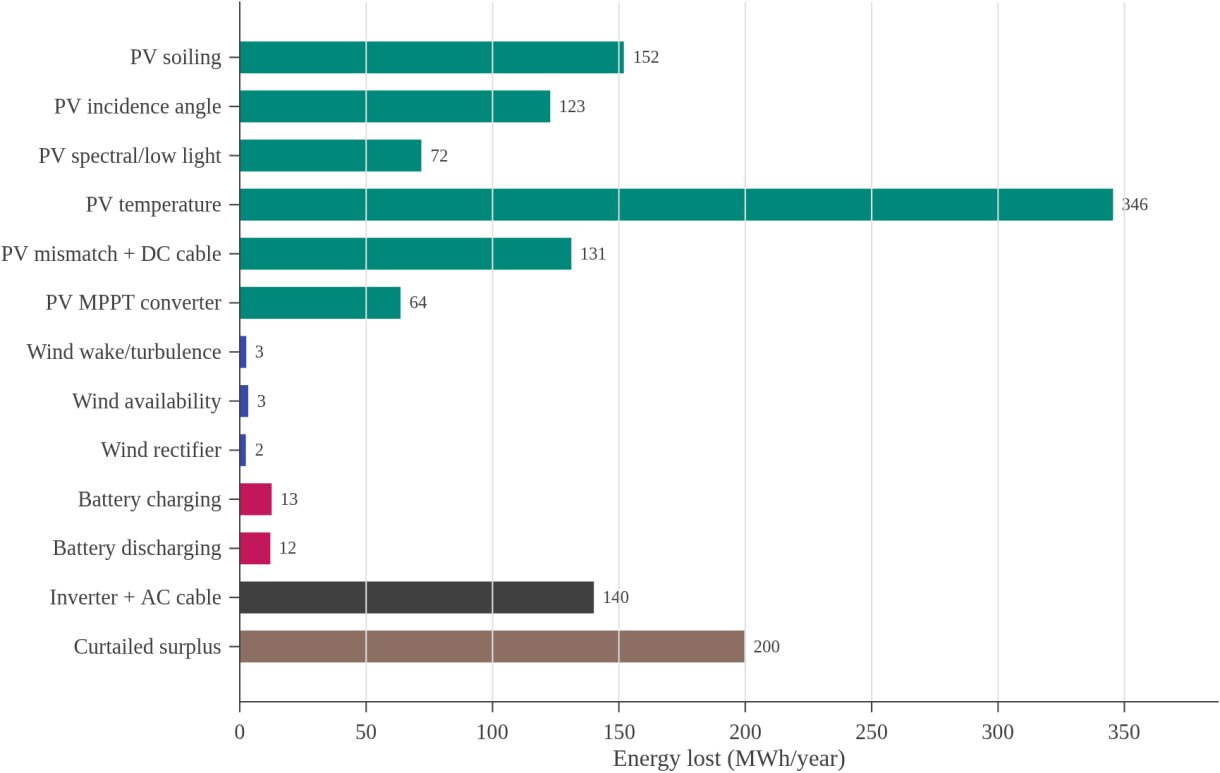
Solar and wind data came from PVGIS for the site. The 30-degree north-facing plane receives 1,958 kWh/m2 a year, with a specific yield of about 1,504 kWh/kWp after 14% system losses. Wind is modest: 3.56 m/s at 10 m and 4.26 m/s at the 36 m hub, which already hints that the turbine will be a resilience component rather than an economic one.
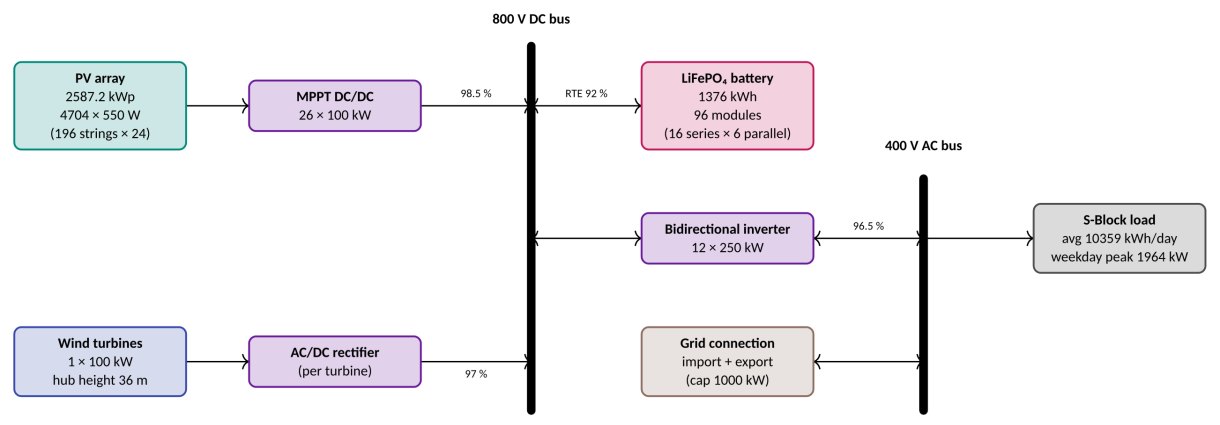
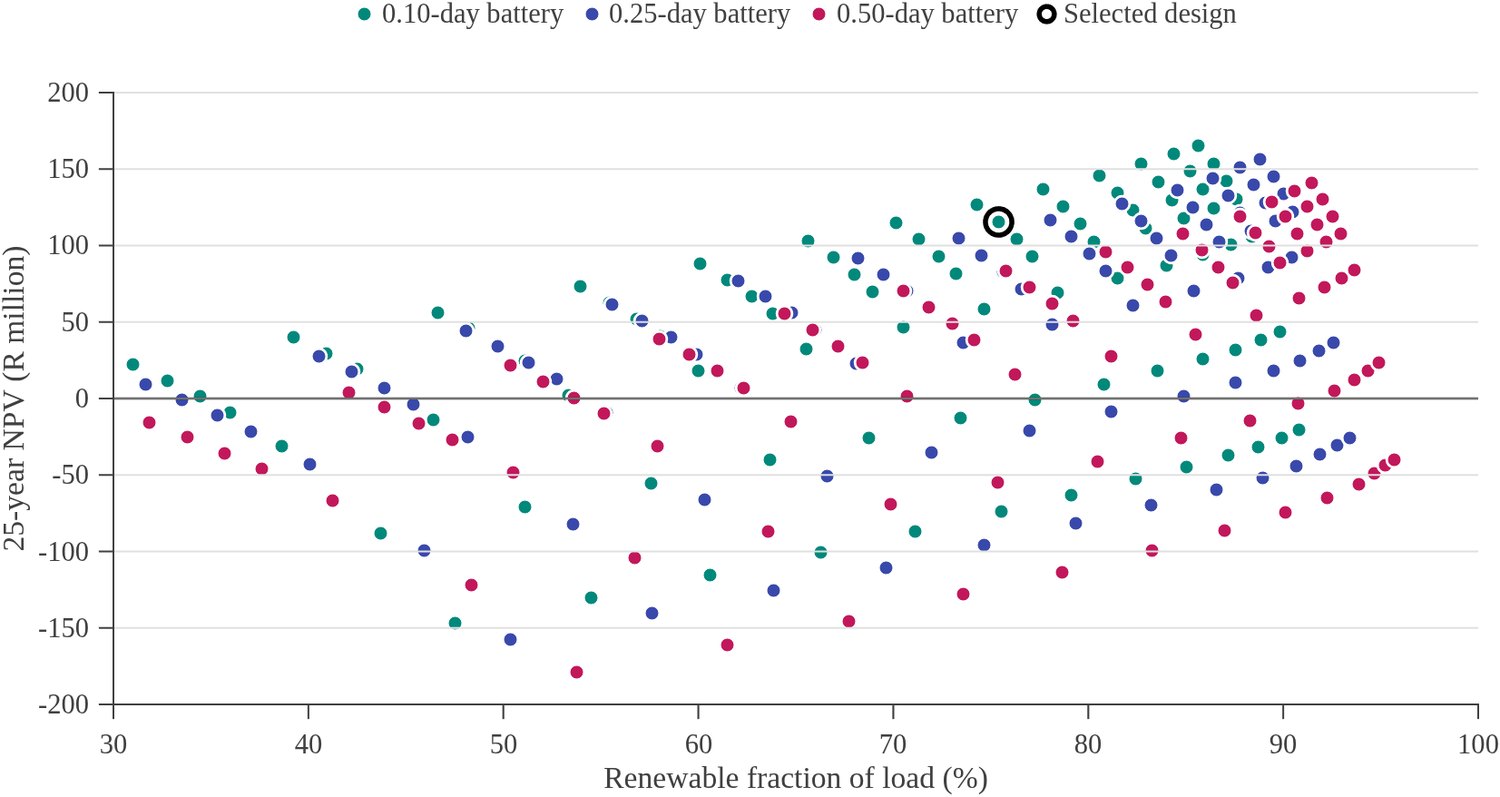
The system was sized with explicit equations, then checked against a 273-configuration sweep. The selected design is 2,587 kWp of PV (4,704 modules), one 100 kW wind turbine, a 1,376 kWh lithium iron phosphate battery (96 modules of 14.336 kWh, 16 in series per string) and 12 x 250 kW inverters on an 800 V DC bus.
Hourly dispatch
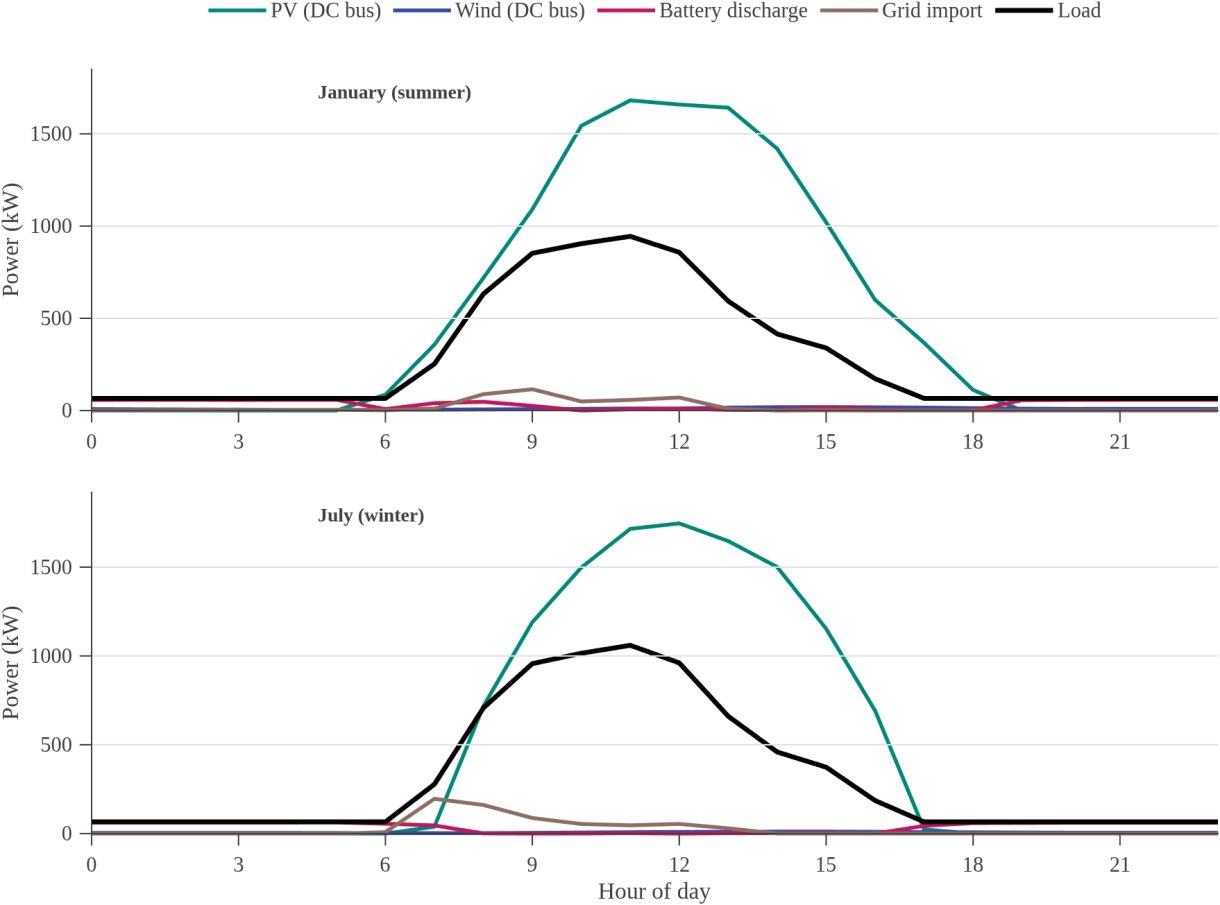
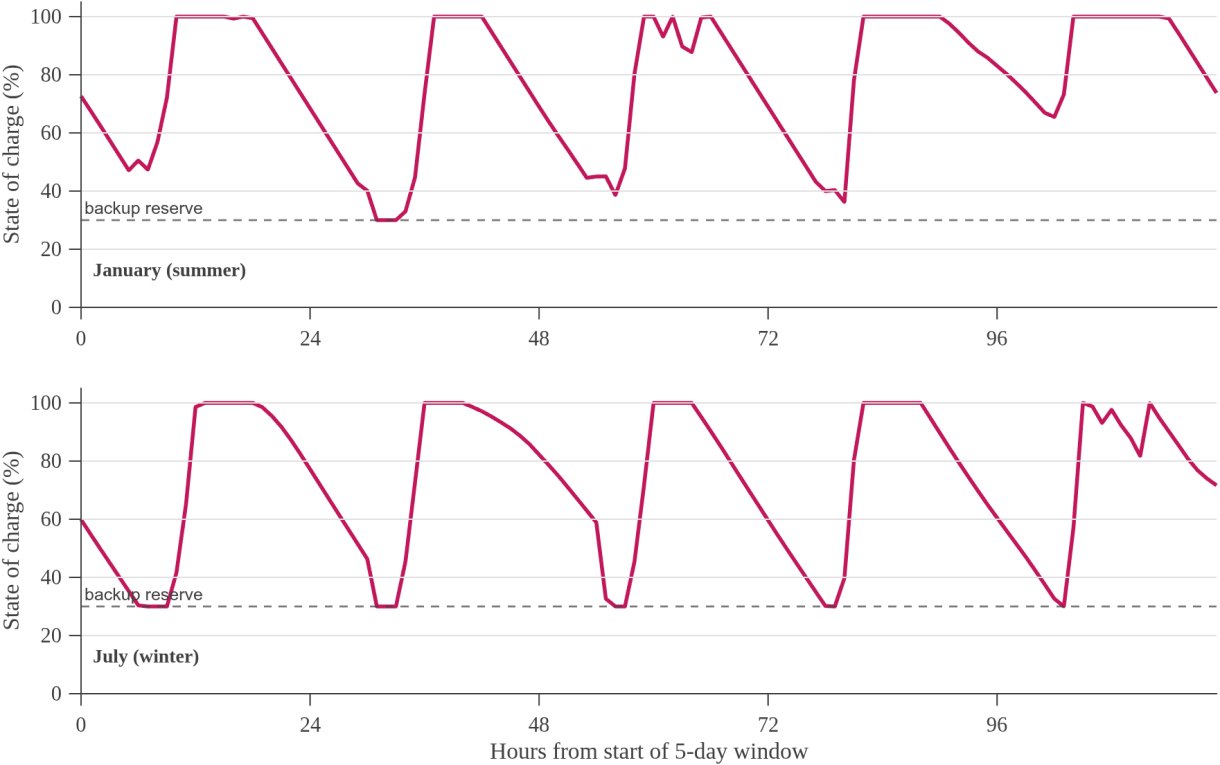
The model runs 8,760 hourly steps with a battery dispatch strategy that charges from surplus PV, discharges to cover the load when generation falls short, and respects state-of-charge limits and converter ratings. Grid import and export are metered separately, with export capped at 1,000 kW.
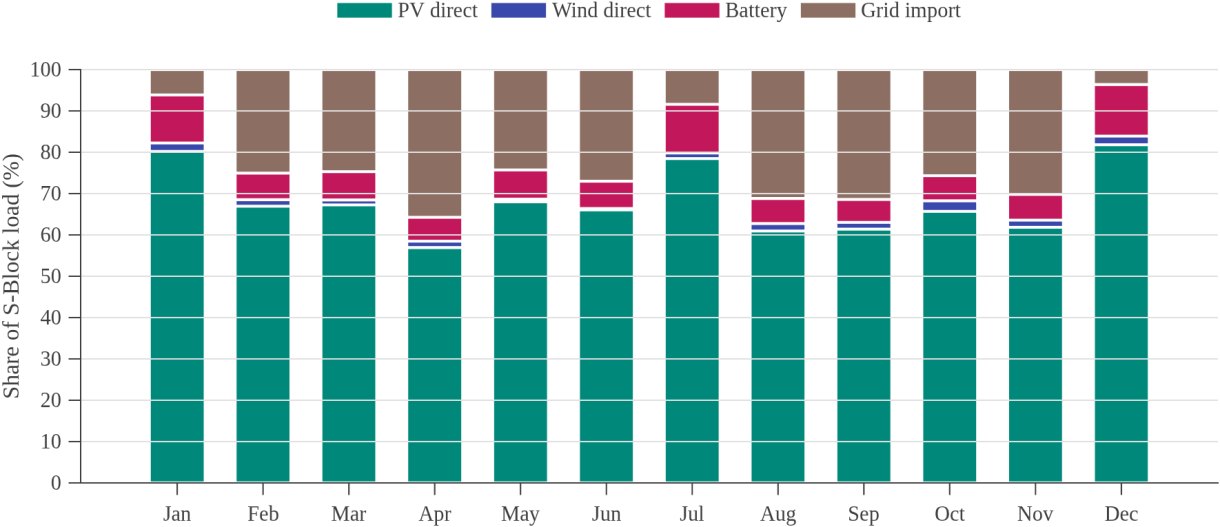
The selected system supplies 75.4% of the load from renewables and avoids about 2,736 t of CO2 a year. Direct PV carries most of the daytime demand; the battery moves the midday surplus into the evening; the turbine contributes little because the site wind resource is weak. That is stated in the report rather than hidden: the design without wind has the higher NPV, and the turbine is included to meet the hybrid requirement.
The economics
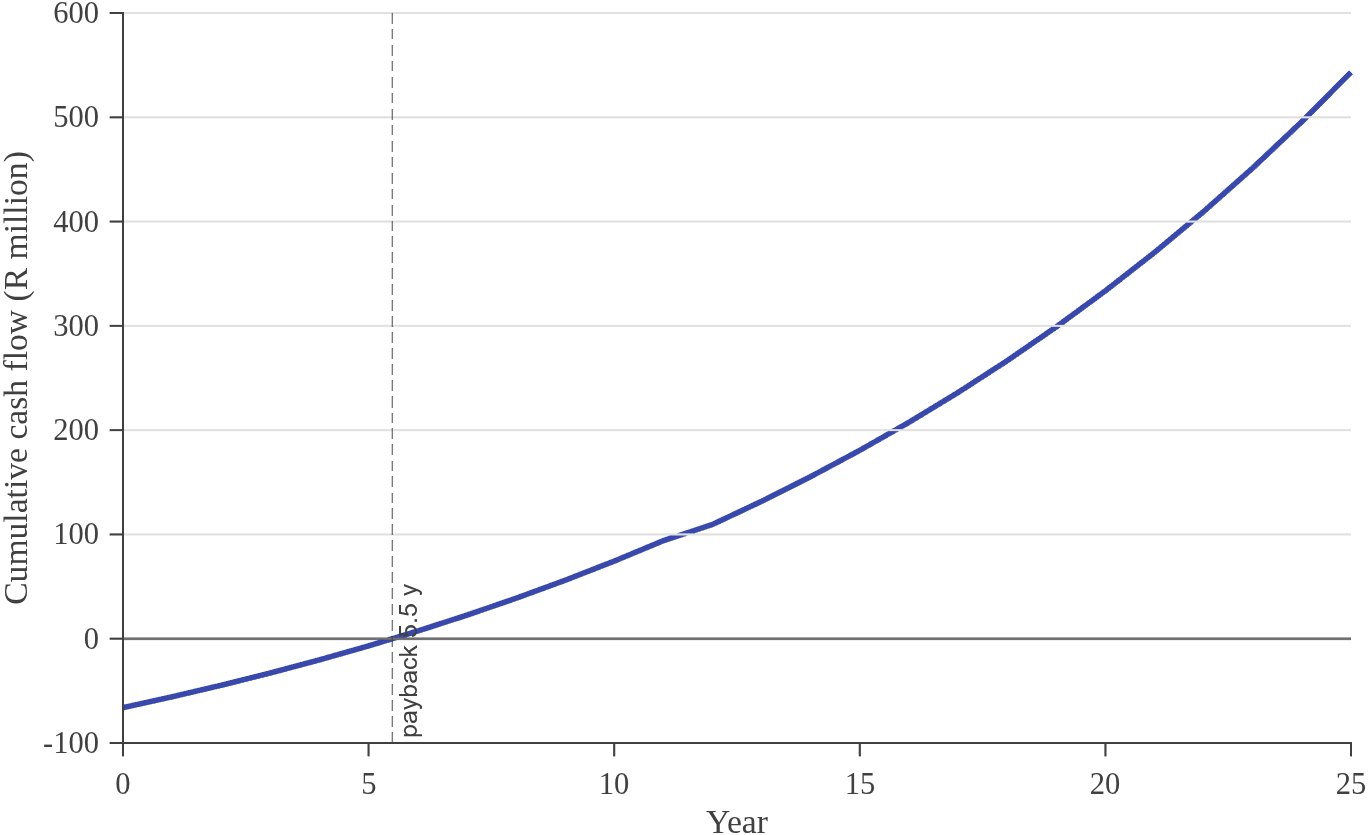
At the assumed unit costs the capital cost is R66.1 million. Against a grid tariff of R2.93/kWh escalating at 7% a year, the 25-year net present value is R115.6 million, the internal rate of return is 21.6% and the simple payback is 5.5 years. The LCOE excludes export credits and is reported alongside the cash-flow result.
The sensitivity pass is the honest part of the study. Unit costs were tested at 80%, 100% and 120%; the ranking of PV-plus-storage designs holds, but the absolute numbers move enough that quotations, not catalogue prices, are the next step. The wind result is the clearest example of an assumption that did not survive contact with the site data.
What I took from it
The engineering value was in the interfaces: the load audit feeds the dispatch model, the dispatch model feeds the economics, and a wrong diversity factor at the start shows up as a wrong inverter count at the end. Keeping those links explicit made the result easier to defend.
The report recommends a phased build that starts with PV and storage, where the economics are strongest, and leaves room for wind only if the resource is measured on site rather than extrapolated. It is a feasibility study, not a construction drawing, and it says so.
Figures